

Your team says an artificial intelligence (AI) tool saves an hour a day. The subscription is affordable. People seem pleased with it. What should you tell the board?
Start by checking what that hour includes. Did someone else spend part of it checking the answer? Did the work meet the same standard? And did the saved time reduce a bill, clear a backlog or simply get absorbed into the day?
This guide helps you build a small, defensible business case. Use the calculator to separate capacity from financial return, then record the quality and human consequences beside the numbers. The examples are fictional. The tools do not verify your evidence or approve an investment.
1. Choose a result the business actually needs
Pick one workflow and name the person accountable for its outcome. “Use AI more” is too vague to evaluate. “Resolve customer queries correctly, with fewer repeat contacts” gives you something to measure.
Write down where the work starts, what counts as finished and who must check it. Include handovers and exceptions. If a tool drafts a report quickly but the reviewer spends longer fixing it, the draft speed is not the result that matters.
Keep three records separate:
- Capacity: staff hours released and where those hours are used.
- Financial return: money saved or additional contribution earned, less the full additional cost.
- Quality and people: correctness, risk, accessibility, workload and the experience of staff and customers.
The UK government’s AI impact evaluation framework warns against automatically turning time saved into cashable savings. It also treats short studies as indicative rather than proof of lasting impact. That distinction matters when a promising pilot becomes a budget request.
2. Record the starting point before changing the work
A baseline is a record of how the process performs now. Use ordinary cases and difficult ones. Record the number examined, the period, the task mix and the definition of a successful result. Keep those definitions consistent during the pilot.
| What matters | What to record | What can mislead you |
|---|---|---|
| Completion | Cases finished correctly, out of all cases attempted. | Counting drafts as completed work. |
| Time | Total staff minutes per case; separately, elapsed waiting time. | Timing generation but excluding checking and handovers. |
| Quality | Cases accepted without corrections and cases with errors, each out of cases reviewed; reopened cases out of cases closed. Record serious errors separately. | Hiding a rare severe failure inside an average. |
| Cost | Additional setup and running costs; evidenced costs avoided. | Counting unchanged salaries as cash savings. |
| Experience | The same short staff and customer questions before and after, plus reasons. | Only asking enthusiasts or treating non-response as satisfaction. |
Use process logs or a small time study where practical. Ask staff about hidden work, but do not rely on recalled time savings alone. A faster average can hide a long queue, so inspect difficult cases and the slow end of the distribution too.
HM Treasury’s evaluation guidance, updated in May 2026, recommends collecting baseline information early and choosing an evaluation design that can distinguish the intervention from other changes. A before-and-after comparison alone cannot show that AI caused the improvement.
3. Compare like with like in a bounded pilot
Where feasible and appropriate, compare similar cases handled with and without the tool during the same period. Assigning eligible cases randomly to the two methods can strengthen the comparison, but it is not suitable for every workflow. Where it is unavailable, document differences between groups and other changes, such as a new policy, quieter demand or extra staffing.
Agree the quality standard before reviewing results. Have someone other than the builder assess a sample, ideally without knowing which method produced it. Record tool versions, prompts, training and process changes so a later reviewer knows what was tested.
For a low-risk, frequent task, a short baseline followed by a limited pilot can expose practical problems. Choose the length from the volume, variability and risk, not a universal “two-week proof” rule. Seasonal demand, rare failures and lasting changes in behaviour require longer observation. Stop a trial when a pre-agreed safety or privacy limit is crossed.
4. Test the numbers without counting a benefit twice
Australia’s National AI Centre includes training, data preparation, testing, change management and oversight in the cost picture. It also notes that saved time needs to be redirected to useful work. A licence price is only one input.
The calculator keeps the estimated value of capacity outside financial return. Enter an avoided cost only when that expense genuinely falls. For new sales, enter additional contribution after direct delivery costs, not the whole sales value. If that contribution already reflects the use of released staff time, do not add the time value again.
Work out the value of one workflow
The starting numbers are a fictional monthly reporting example in Jamaican dollars. Replace them with evidence from your own process. Inputs stay in this page’s memory and are not submitted by these tools. Avoid entering personal or confidential details.
Capacity, kept separate from cash
- Net staff time released each month
- Time put to useful work each month
- Estimated monthly value of usable capacity Not included in financial return.
- Total additional cost
- Net financial benefit
- Financial return on investment
- Simple payback from the start of benefits Assumes the monthly net benefit continues.
In the fictional example, the manager plans to put only part of the released time to useful work. The capacity estimate reflects that assumption. The cash and contribution inputs illustrate different, non-overlapping financial benefits. They are not results from an AI Boss client.
Try reducing the financial-benefit realisation input and increasing review time. A case that works only with perfect adoption or no exceptions needs more testing. These are sensitivity checks, not statistical confidence intervals. The calculator does not estimate an investment’s probability of success.
See the calculation method and its limits
Monthly cases are multiplied by the share using AI. Before and after times both include human review and rework. The usable share applies only to positive time released. A slower process remains a full time burden. In the formula, H is net monthly staff hours, N is monthly cases, a is the share using AI, t is staff minutes per case and u is the share put to useful work. The formulas use shares between zero and one; the input fields use percentages.
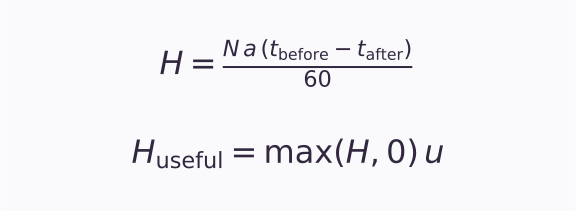
Financial benefits contain only separately entered cash costs avoided and additional contribution, adjusted by the chosen scenario share. Costs contain setup plus the additional monthly running cost over the chosen period. Every monetary input must use the same currency. Cash and contribution inputs must already reflect the adoption level you entered. Changing adoption changes the time calculation only; revise the financial inputs separately when adoption changes.
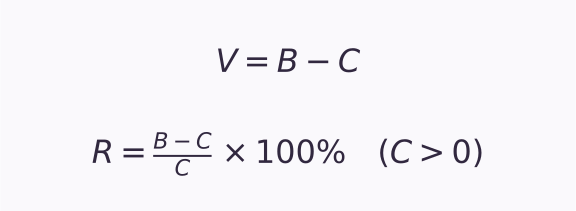
Simple payback divides setup cost by positive monthly financial benefit after running cost. It is not defined when that monthly net benefit is zero or negative. Financial return is not defined when total cost is zero. In the formula, B means financial benefits over the comparison period, C means additional costs over that period, V means net financial benefit and R means the return percentage. No discount rate, tax, inflation, timing of cash flows or foreign exchange is modelled. The tool accepts non-negative benefit inputs. It does not quantify lost sales, serious incidents or other harms; record those separately. A positive return cannot override an unacceptable risk. A finance reviewer should extend the model for a material investment.
5. Ask what changed for the people doing the work
Use a short set of consistent questions, then ask for an example. Staff might report less repetitive work but more checking, or faster answers but less confidence in their source. Those differences help explain the numbers.
Useful prompts include: “How much effort did this task require?”, “Could you identify and correct a wrong answer?”, and “What was easier or harder than before?” For customers, ask whether they resolved the issue and what remained unclear. Record how many people were invited and responded. Where appropriate, offer a private way to raise concerns. Do not use feedback to rank individual employees.
The National Institute of Standards and Technology’s AI Risk Management Framework calls for quantitative and qualitative assessment in the deployment context, including feedback from users and affected people. The scorecard below is an original discussion aid informed by those principles, not a compliance rating.
Record what the financial number cannot tell you
Select an evidence state for each area. These are not numerical scores and are never converted into money or averaged into a pass.
The download contains your inputs and note. Keep it in an appropriate location. This page does not email or publish it.
6. Make a decision, then check again
Before expanding, the accountable owner should review the evidence with the people responsible for delivery, finance and relevant risks. Decide whether to continue, change the process, gather more evidence or stop. There is no universal return threshold that makes every use case worthwhile.
- Define the outcomeName the owner and the minimum acceptable standard.
- Measure the baselineRecord the current process, including exceptions.
- Run a bounded pilotCompare similar work and log what changed.
- Review the evidenceRead financial, quality and people measures together.
- Change or stopAddress the failures before widening use.
- Measure againKeep the original baseline. Date and version any new comparison after a process change.
Give the board a short statement it can challenge: the workflow, the observation period, the sample, the measured change, the additional cost, what remains uncertain and the next decision. Keep the supporting records. When the model, data or process changes, check that the benefit and safeguards still hold.
For your next pilot, begin with one question: what evidence would convince you that the process improved? Agree that answer before looking at the calculator’s result.
Practical guidance and original teaching tools by Adrian Dunkley. Sources checked on 28 October 2026. The calculator is a simplified comparison, not financial advice, an audited benefit statement or a certification.
Sources & further reading
HM Treasury: impact evaluation of AI interventions (updated 15 May 2026) ↗UK government: AI impact evaluation framework ↗Australia National AI Centre: measure return on investment ↗NIST AI Risk Management Framework 1.0: core (2023) ↗Sources checked 2026-10-28. Institutional guidance, not independent proof of a particular investment’s return. The calculator and checklist are original teaching aids.